|
|
|
|
|
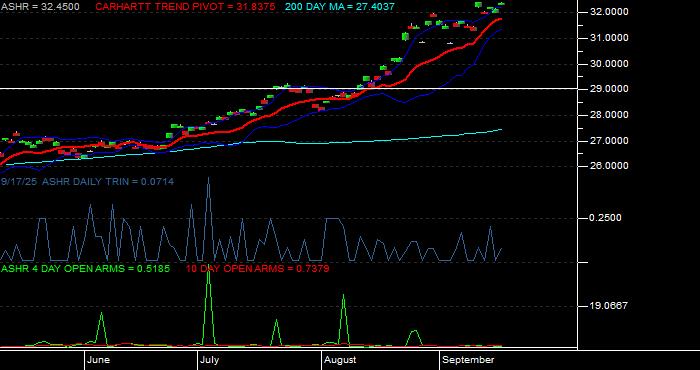
| Xtrackers Harvest CSI 300 China A-Shares ETF
- DailyTrin, ARMS and Open ARMS |
|
|
 |
| |
|
|
|
|
|
|
|
ASHR - DB XtrackersHarvest CSI 300 China A-Shares ETF
|
| The investment seeks investment results that correspond generally to the performance before fees and expenses of the CSI 300 Index. The fund will normally invest at least 80% of its total assets in securities of issuers that comprise the underlying index. The underlying index is designed to reflect the price fluctuation and performance of the China A-Share market and is composed of the 300 largest and most liquid stocks in the China A-Share market. The underlying index includes small-cap mid-cap and large-cap stocks. |
|
| |